
Team Testing & Combines
One test day. One team. One clear picture.
Coaches see the game. VYTA makes the athletic foundation measurable. Together they give a clearer picture for selection, development and training planning.
We set up the stations at your venue, the team rotates through the Combine in groups and every result is recorded digitally.
Team size
Test duration
Stations
Team Report
For you if you
- want to know objectively where your team stands
- want to justify decisions instead of going on feel
- want to know which abilities separate the squad
- want a baseline the next block can be measured against
- Price
- on request
- Location
- mobile at your venue, from Winterthur
- Recording
- digital, via tablet
- Results
- in the VYTA App
- Quote
- within 2 working days
Why a combine
A combine does not replace sporting judgement.
It adds objective performance data to it.
Many decisions in sport are based on observation, experience and feel. That stays important. A combine also shows which athletic profiles your team has:
- Who is fast over the first metres?
- Who puts explosive power into the ground?
- Who changes direction efficiently?
- Who copes with repeated efforts?
Test catalogue
What we build your protocol from.
The choice of tests depends on the sport and the team’s goals. We measure what tells you something, and the retest runs the same protocol again.
Linear Speed
Shows how quickly athletes accelerate, how high their sprint speed is and where in the sprint profile time is gained or lost.
- Typical tests
- 5 to 30 m sprint
- 20 Yard Dash
- Flying Sprint
- Metrics
- Split times · Acceleration · Max Speed · Speed Drop-off
Explosiveness
Shows who turns force into fast movement: vertically, horizontally and reactively. And how big the differences within the team are.
- Typical tests
- Countermovement Jump
- Abalakov
- Drop Jump
- Broad Jump
- Metrics
- Jump Height · Peak Power · RSI · Impulse · Takeoff Velocity · Asymmetries
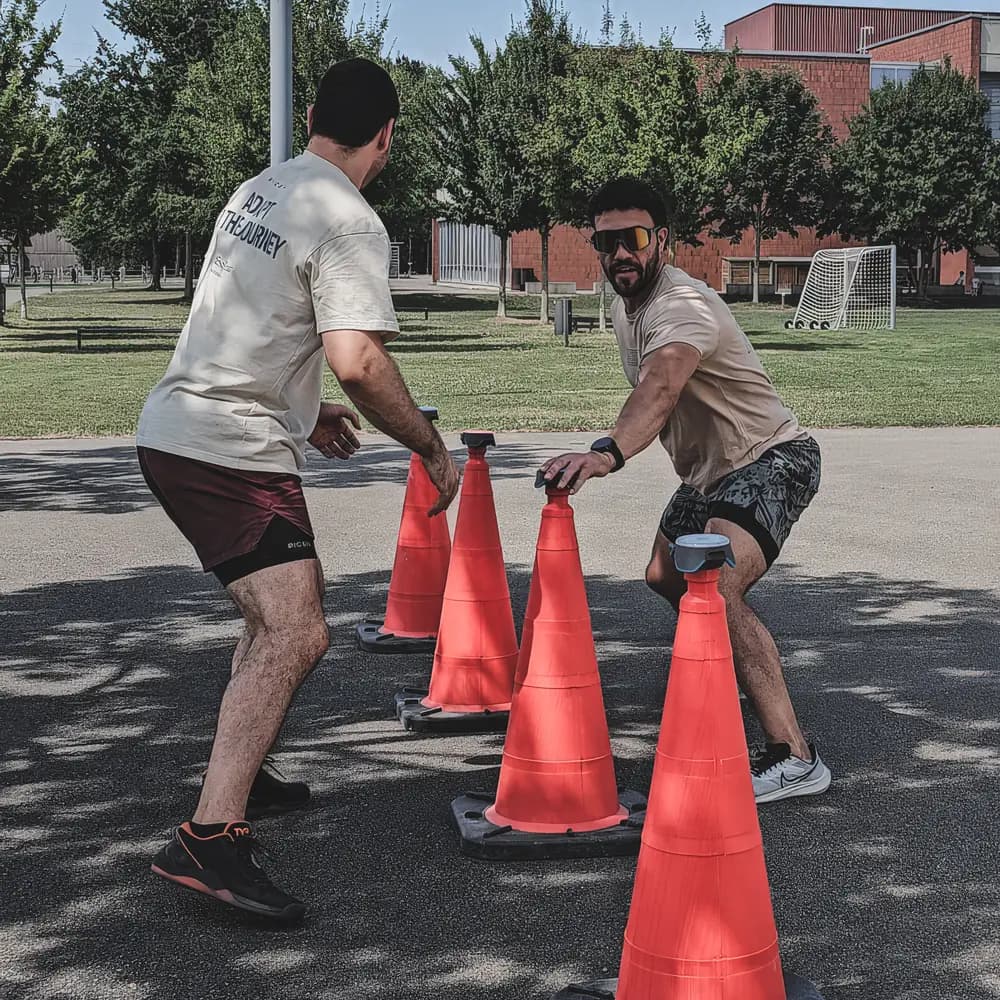
Change of Direction
Shows who can brake, redirect and accelerate again, and where time is lost when changing direction.
- Typical tests
- 5-10-5
- L-Drill
- sport-specific COD setups
- Metrics
- Total time · Split times · COD Deficit · Re-Acceleration
Maximal strength
Shows the team's strength base, without unnecessary technical risk from maximal lifts.
- Typical tests
- Isometric Mid-Thigh Pull
- Isometric Squat
- Grip Strength
- Metrics
- Peak Force · relative Force · Left/Right Balance · Force-time curve
Endurance
Shows who can repeat efforts and sustain output over time, and where in the team capacity drops off earlier.
- Typical tests
- Ramp test
- Step test
- Repeated Sprint Ability
- sport-specific ergometer protocols
- Metrics
- VO2max · Threshold · Heart rate zones · Performance decline · Recovery
Robustness
Shows asymmetries and physical findings that can be relevant for load capacity, prevention and long-term development.
- Typical tests
- Single-Leg Tests
- Mobility Checks
- 3D Body Scan
- Metrics
- Asymmetries · Movement range · Segment circumferences · Body composition
Outcome
What you have in hand after the test day.
- 01
Digital recording
Every station runs on a tablet and the values go straight into the system. No paper sheets, no transcription errors in the evening.
- 02
Team Overview
The whole team on one page, all values side by side instead of spread across sheets and spreadsheets.
- 03
Team Leaderboard
Ranking per discipline. In our experience, the number everyone talks about on the bus home.
- 04
Metric Winners
Who leads in which discipline. The recognition that lands straight away on test day.
- 05
Athlete Profiles
Every athlete gets their own profile in the VYTA App, with their position within the team.
- 06
Team Performance Report
In writing: the team's strengths, the focus areas for the group and a training strategy that fits the profile.
- 07
Coach Debrief
A meeting with the staff where we go through what the numbers mean for the next training phase.
- 08
Retest Baseline
Recorded baseline values and a protocol that runs identically on the next test day.
Example
Team Leaderboard and Power-Speed Map.
Measured values become usable analysis: the coaching staff gets a team overview with rankings, strengths and areas to develop. Athletes see their own results directly in the VYTA App.
Ranking
| Rank | Athlete | Points | 20 m |
|---|---|---|---|
| 1 | A1 | 6 | 3.19 |
| 2 | You | 9 | 3.08 |
| 3 | A3 | 14 | 3.28 |
| 4 | A4 | 15 | 3.12 |
| 5 | A5 | 16 | 3.23 |
| 6 | A6 | 24 | 3.34 |
Points are the rank per discipline. Lower is better.
Group median
- CMJ
- 30.4cm
- Broad Jump
- 223cm
- 20 m Sprint
- 3.21s
- 5-10-5
- 4.86s
Power-Speed Map
Explosiveness · jump height in cm
- Power-Speed
- 2
- Speed-Dominant
- 1
- Power-Dominant
- 1
- Development zone
- 2
above the median in jump height and sprint
sprint above the median, jump height below
jump height above the median, sprint below
below the median in both metrics
The axes are oriented so that better performance always lies to the right and at the top.
Sample profile. Anonymised, with sample values.
For the staff
What the test day answers for you.
A leaderboard is entertaining. These six questions are the reason a combine pays off for the coaching staff.
- 01
Who are our top performers?
Not by impression from training, but by measured value, across all disciplines.
- 02
Which athletes are specialists?
Who is far ahead in one area and far behind in another. These profiles need different training from the all-rounders.
- 03
Which profiles do we have in the team?
The spread across strength, speed, explosiveness and endurance. It shows which style of play the team can actually carry.
- 04
Which abilities separate the squad?
Where the spread within the team is largest. That is exactly where it is decided who plays.
- 05
Where does training pay off most?
The areas where the whole team is below the level your league demands.
- 06
Which values do we track in the retest?
A recorded baseline and a short list of metrics the next block can be measured against.
Case Insight
What a national combine showed.
In a national combine there was a clear overlap between standout combine profiles and athletes who were selected later.
Several of them were in the top 10 of the overall ranking. Particularly strong speed, power and explosiveness values were also represented in the later selection.
This shows: a combine does not replace a sporting decision, but it can make relevant athletic profiles visible early.
Process
From enquiry to retest.
After a short briefing we plan the entire combine within two to three weeks. The test day is fitted to your training schedule and fully prepared, run and analysed by VYTA.
- 01
Briefing with the staff
Team size, sport, phase of the season and what you want to decide at the end. Then you receive a quote.
- 02
Defining the test protocol
We choose the stations that tell you something for your sport and leave out whatever only costs time.
- 03
Combine on site
Three to eight stations in parallel, groups rotate. Two to six hours, depending on team size and test scope.
- 04
Team Report and Leaderboard
Within three days: team overview, leaderboard, Metric Winners and the individual profiles in the app.
- 05
Debrief and retest
Review with the coaching staff, optionally a retest after pre-season or at the end of the season.
Teams & Coaches
What athletes and coaches see with VYTA
Feedback from Assessments and Combines.
- Combine
Before the Combine, we mainly had our own impressions. Afterwards we could see clearly for every player where she stands and what we need to work on specifically in pre-season. It was organised professionally and took very little effort on our side.
Sarah WalserFootball, Combine
Enquiry
Tell us what your team looks like.
A few key details are enough. We will get back to you within two working days with a proposal for test scope and a quote, or write directly to info@vyta-life.ch.
Still have questions about the combine?
Location, team size, phase of the season: send us the key details and we will tell you what can realistically be measured on the test day.